The BPM Panel
The BPM panel provides a graphical interface to query and visualise information for the BPM data files, i.e. the Turn-by-Turn data and select the data to be analysed further.
Loading Data
Measurement Groups aka Kick Groups
Not yet implemented
The GUI does not yet support loading of measurement groups (i.e. kick groups). The idea is to load all data from a single kick-group, as defined in the Multiturn GUI at once or monitor a currently active kick-group and load the files as they are created.
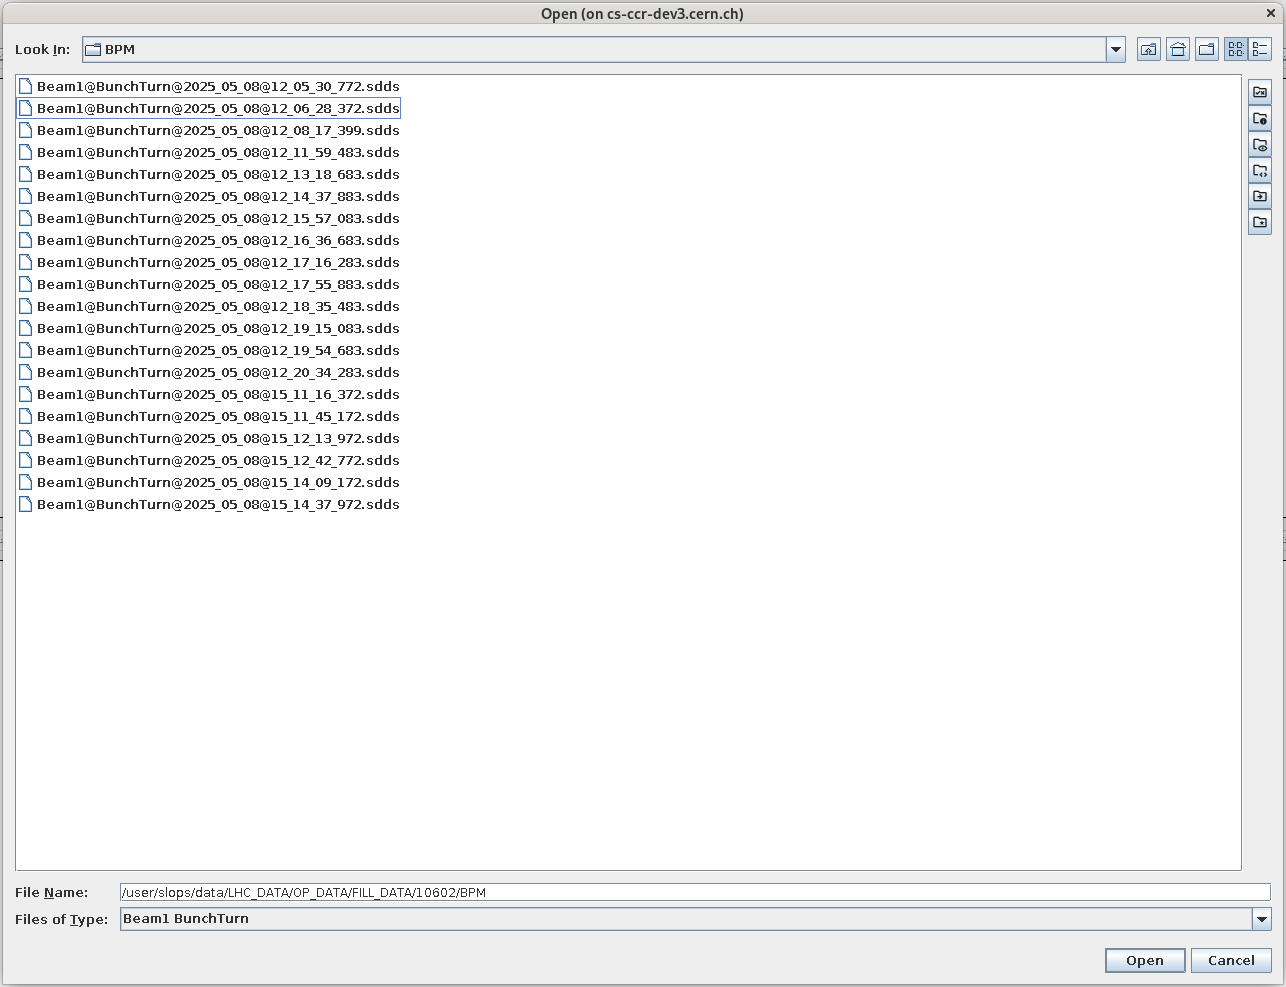
Open Files
Use the button to open turn-by-turn data.
Model Required
To be able to load files, you need to first need to have a model loaded. The name of the model will appear at the top of the GUI. This is required, as the BPMs are checked vs the model and sorted by longitudinal location.
Naming Filter
For the LHC, the displayed files in the file dialogue are automatically filtered to show only @BunchTurn files of the currently selected beam.
You can change/deactivate that filter ("Files of Type") at the bottom of the dialogue!
Multiple files can be opened at once and are added to the current Measurements directory, as well as to the table of loaded files in the panel.
If the file contained multiple bunches, they are added as separate entries (see below).
If the "Analyse TbT files on opening" setting is active, a window will open to prompt the user with the "Do analysis Dialogue".
Reopening Files
- If you are opening a file with the same filename as an already opened file, an error will be thrown.
- If you want to open a new file with the same name as a previously opened file, i.e. one with the same name in the
Measurementsdirectory, a popup will ask if the old file should be overwritten or simply opened instead (without running the converter). - If you restart the GUI and select the "Load Data" option in the beam selection window,
all files in the
Measurementsdirectory in the selected Output Path will be reloaded (without running the converter).
Supported File Formats
The GUI itself only supports the opening of LHC-type (dual plane BPMs) or SPS-type (single plane BPMs) binary .sdds files.
You can choose in the gui tab of the settings which format your turn-by-turn data is and if you want
to convert it into one of the supported formats.
The GUI will then call the omc3.tbt_converter to convert the file.
All formats that can be read by the turn-by-turn package are supported.
If you choose the "DO NOT CONVERT" option, the files are simply copied into the current Measurements directory.
ASCII files
The old ASCII format (for SPS and LHC), which is still in use in some older conversion scripts and MAD-X tracking scripts,
is identified automatically by the converter when choosing lhc or sps as the file type to be opened.
One can use the same format for the conversion, i.e. lhc or sps respectively, and the converter will output the data in binary format.
The ascii input format can also be chosen directly.
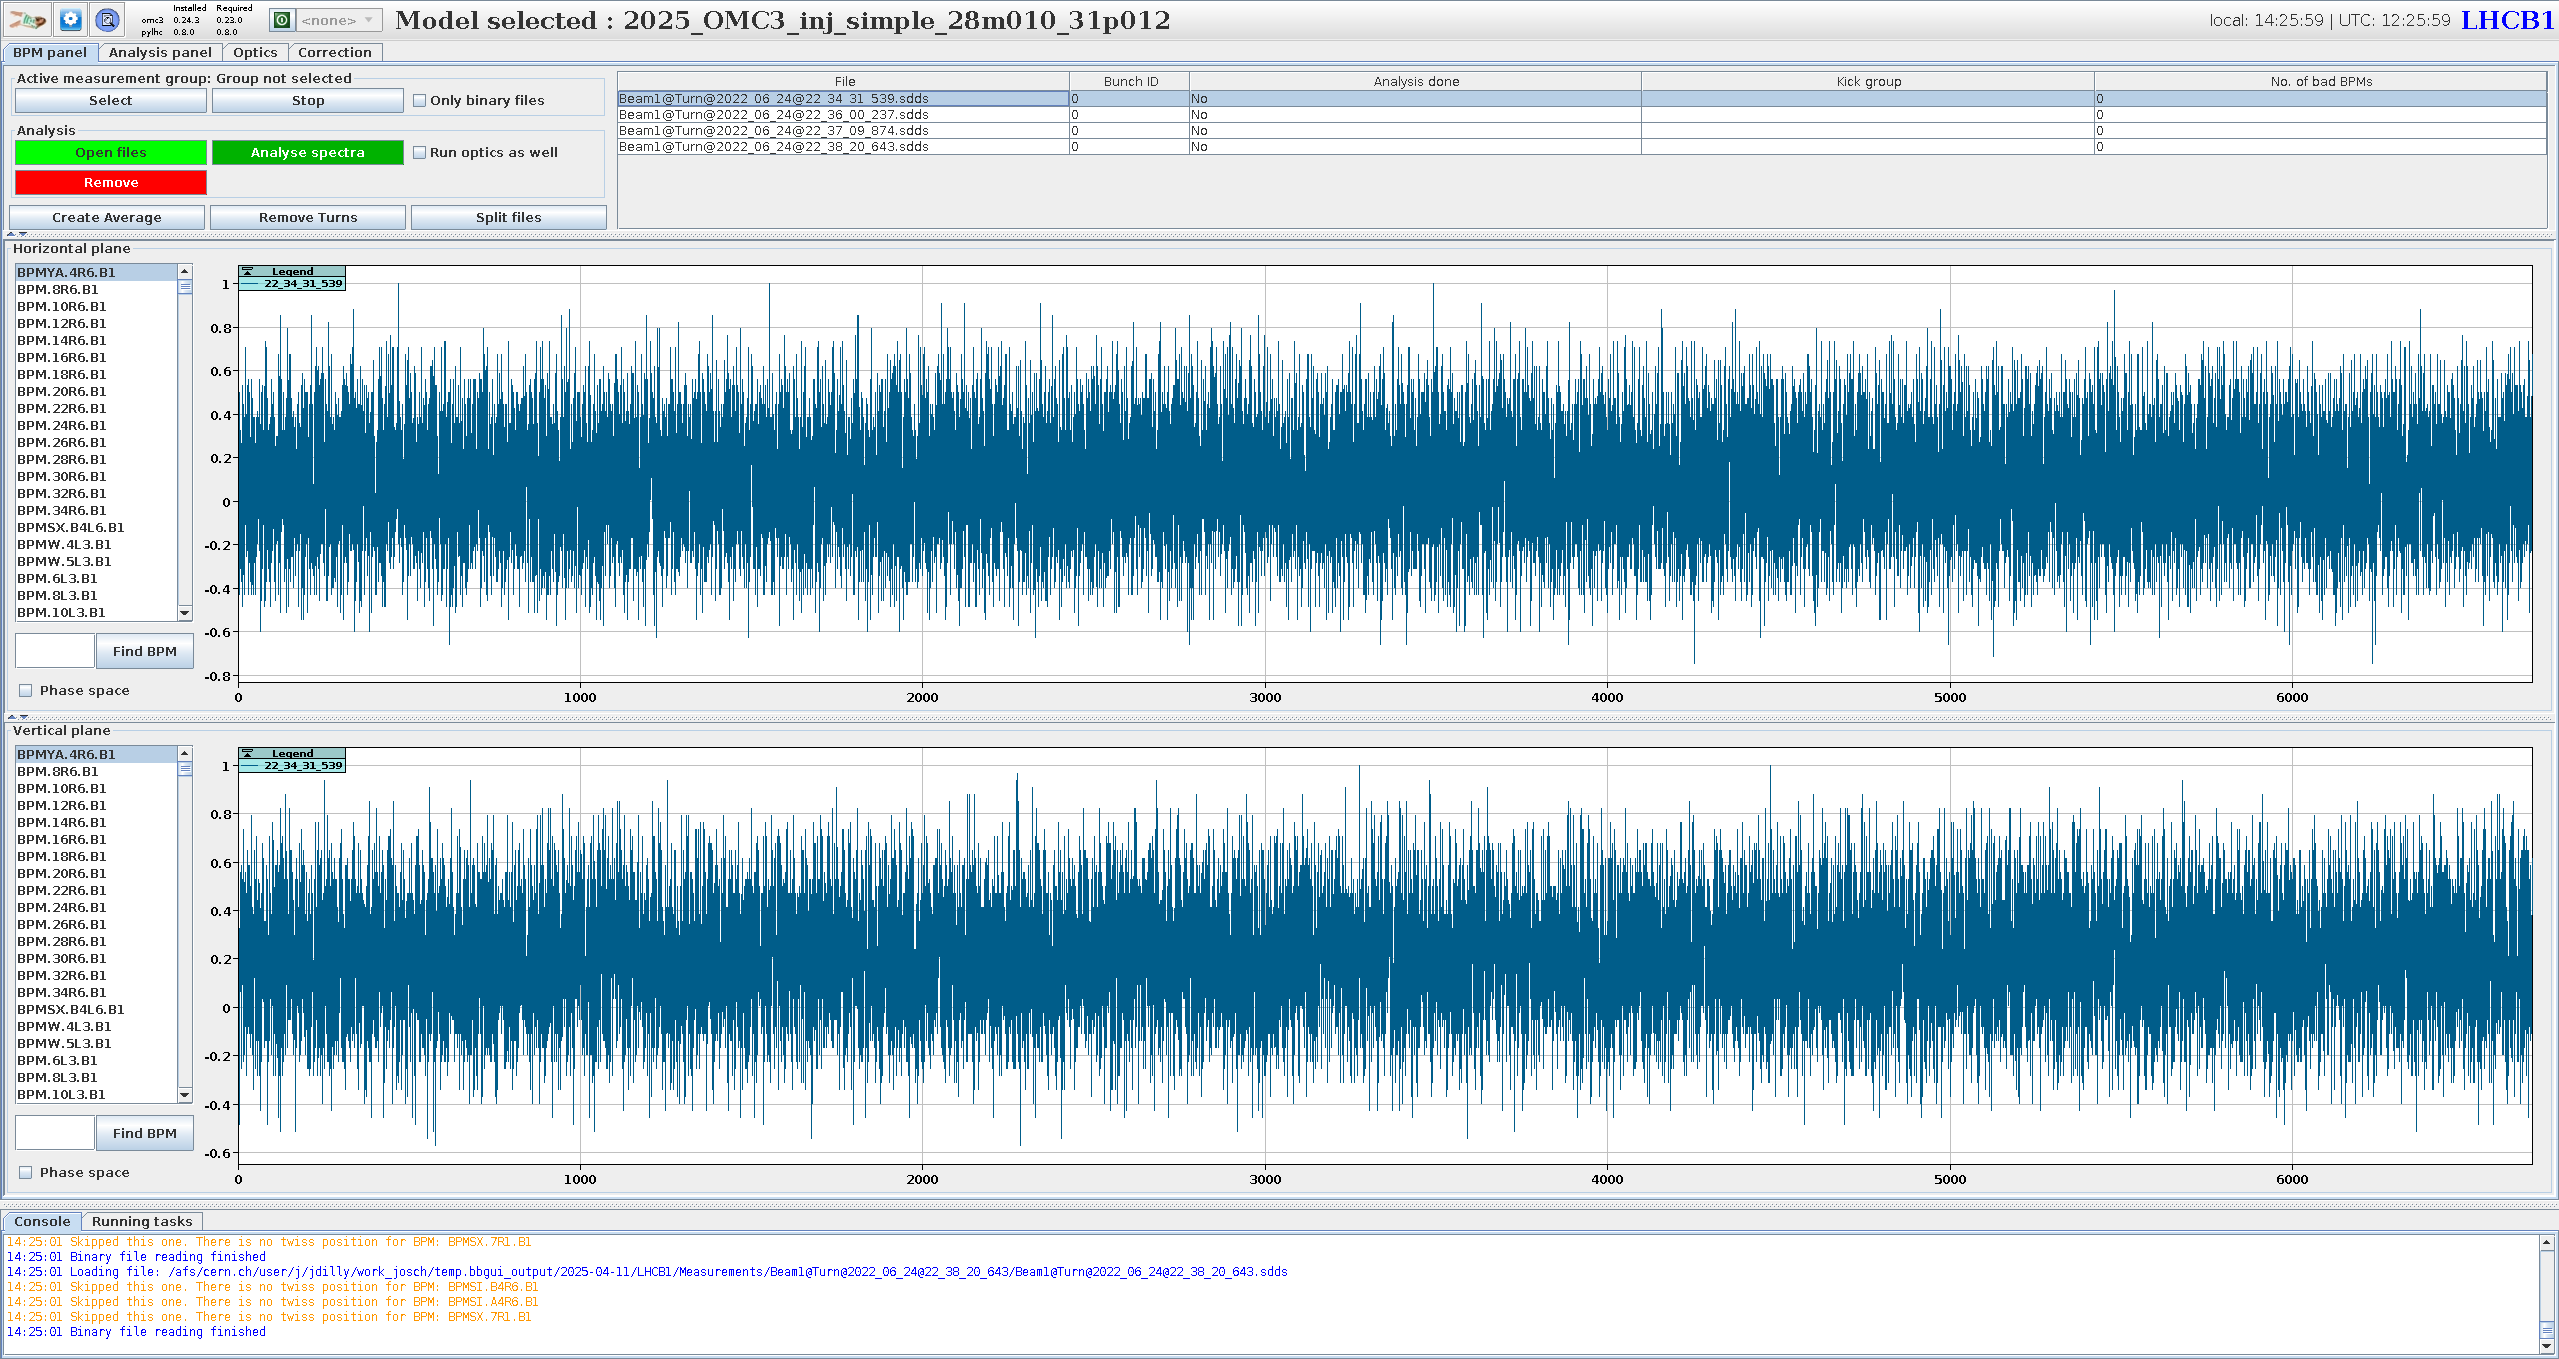
Table of Loaded Files
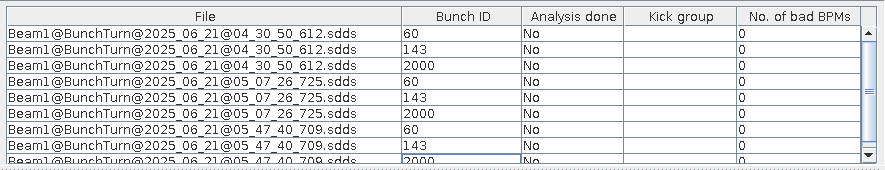
The table at the top of the panel shows the files that are currently opened in the GUI.
These are not necessarily all files present in the Measurement directory, as they need to be explicitly opened!
Each column in the table provides information regarding the opened measurement:
- File: Name of the file, without the path.
- Bunch ID: The ID of the bunch within the file. If the file contains multiple bunches, multiple entries with the same File name, but different Bunch IDs will be created.
- Analysis Done: Indicator stating whether the analysis has been performed on this file. ( Currently not working.)
- Kick Group: Name of the Kick Group this file belongs to. ( Currently not working.)
- No. of bad BPMs:
Number of bad BPMs identified in this file as a sum between the two planes.
This value is
0upon loading the file and will be updated when the harmonic analysis is done, which also performs the BPM filtering if cleaning is active. Bad BPMs will be marked in red in the BPM lists below.
( The default value for the case of something going wrong when updating this value is-1per plane and hence sometimes-2is shown in this column, e.g. when the bad-BPM output file is missing.)
Memory Usage
File that are opened in this panel are stored in memory. If your computer is running low on memory, you might want to close some of the open files.
Removing Entries
Clicking on the button will remove the selected entries from the table of loaded files.
This will not remove the files from the Measurements directory!
Investigating Turn-by-Turn Data
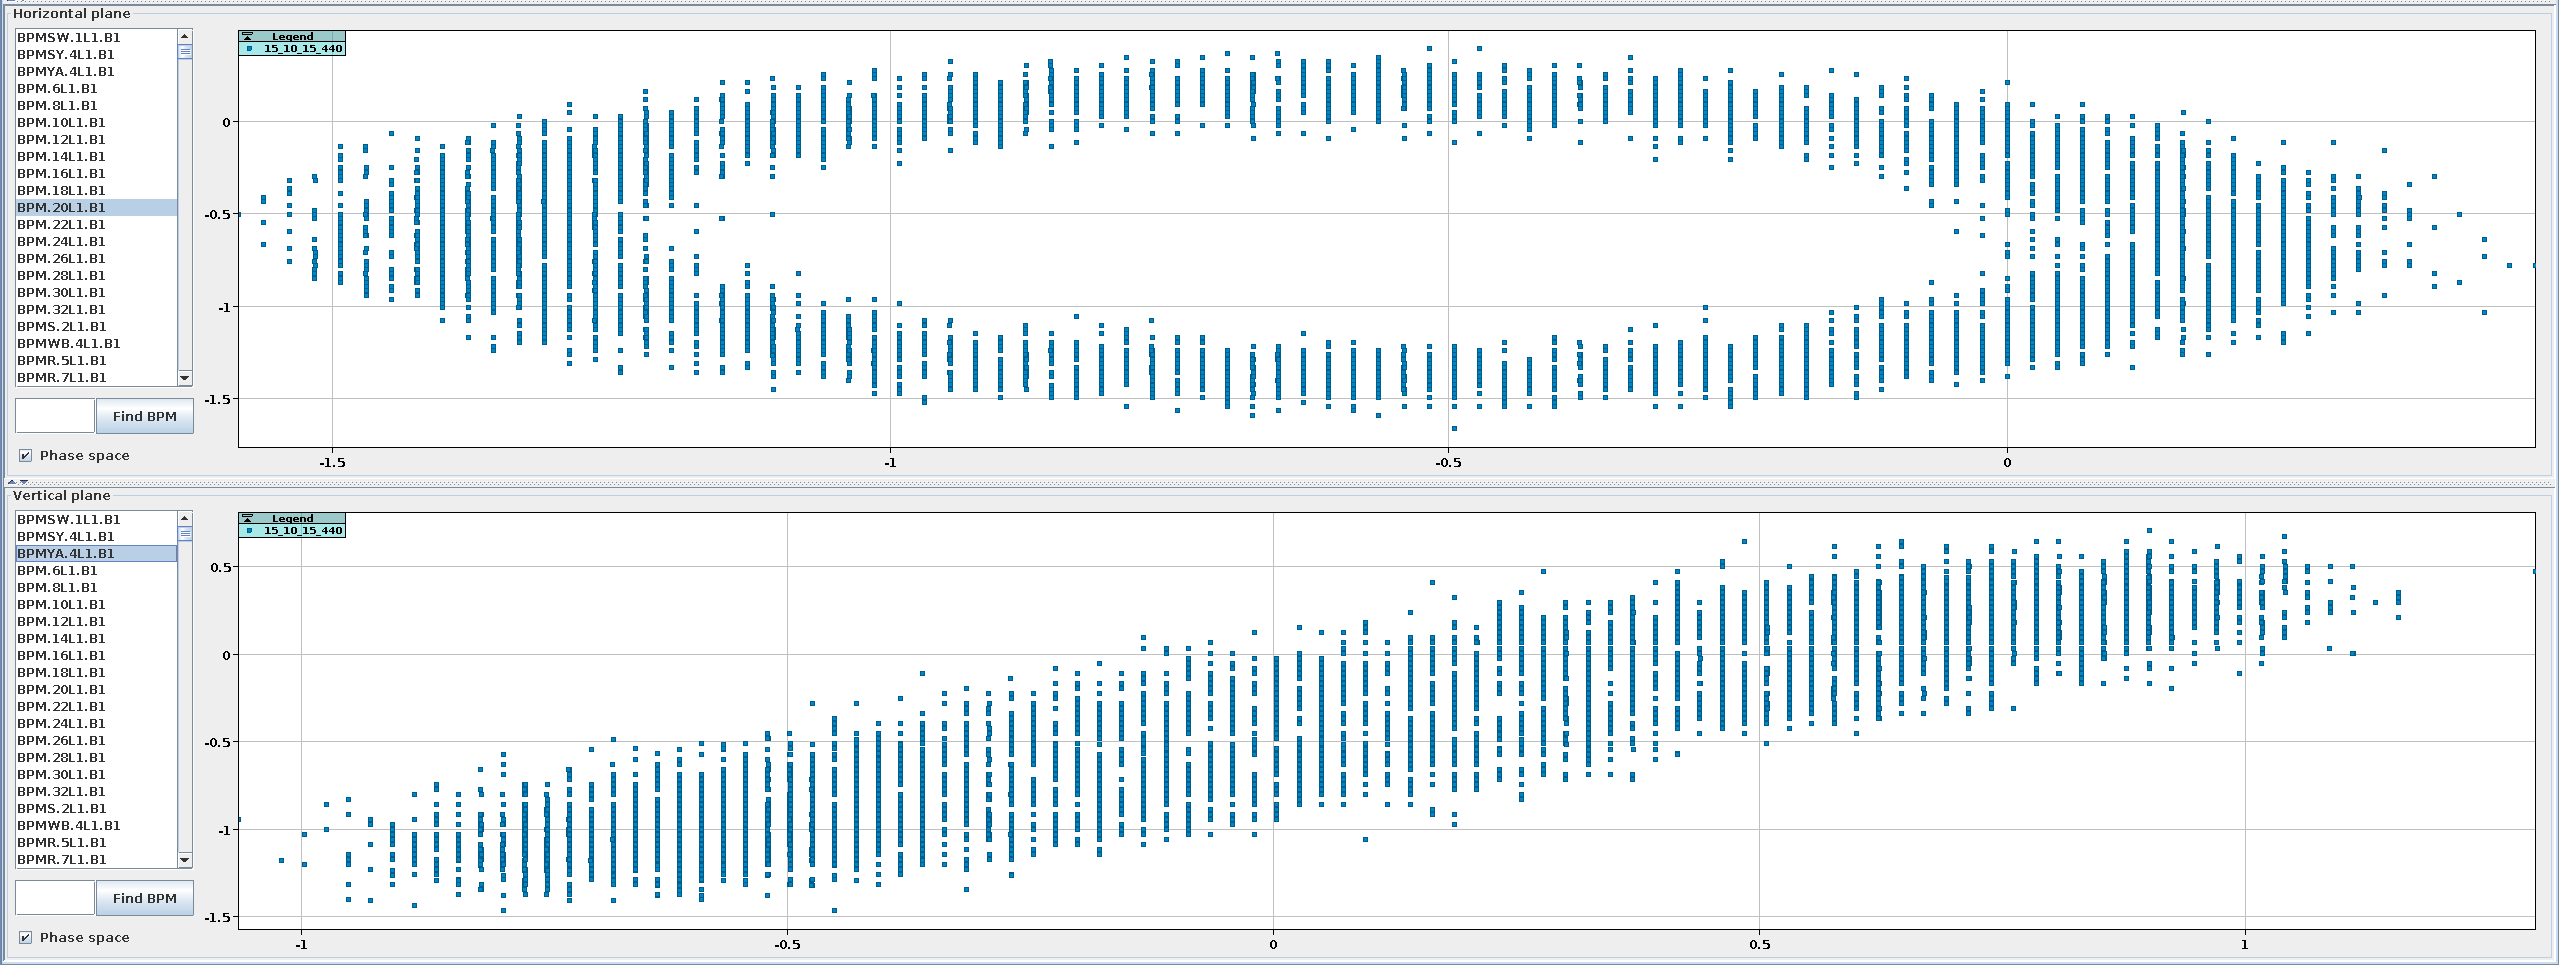
After selecting one or more files in the table of loaded files, the turn-by-turn data is visualised in the two bottom charts, one for each plane. The charts are interactive and can display either the measured amplitude values over turns for every BPM from the list or display the phase space, which is calculated by two consecutive BPMs. You can select multiple measurements at once to compare them, but only one BPM per plane at a time.
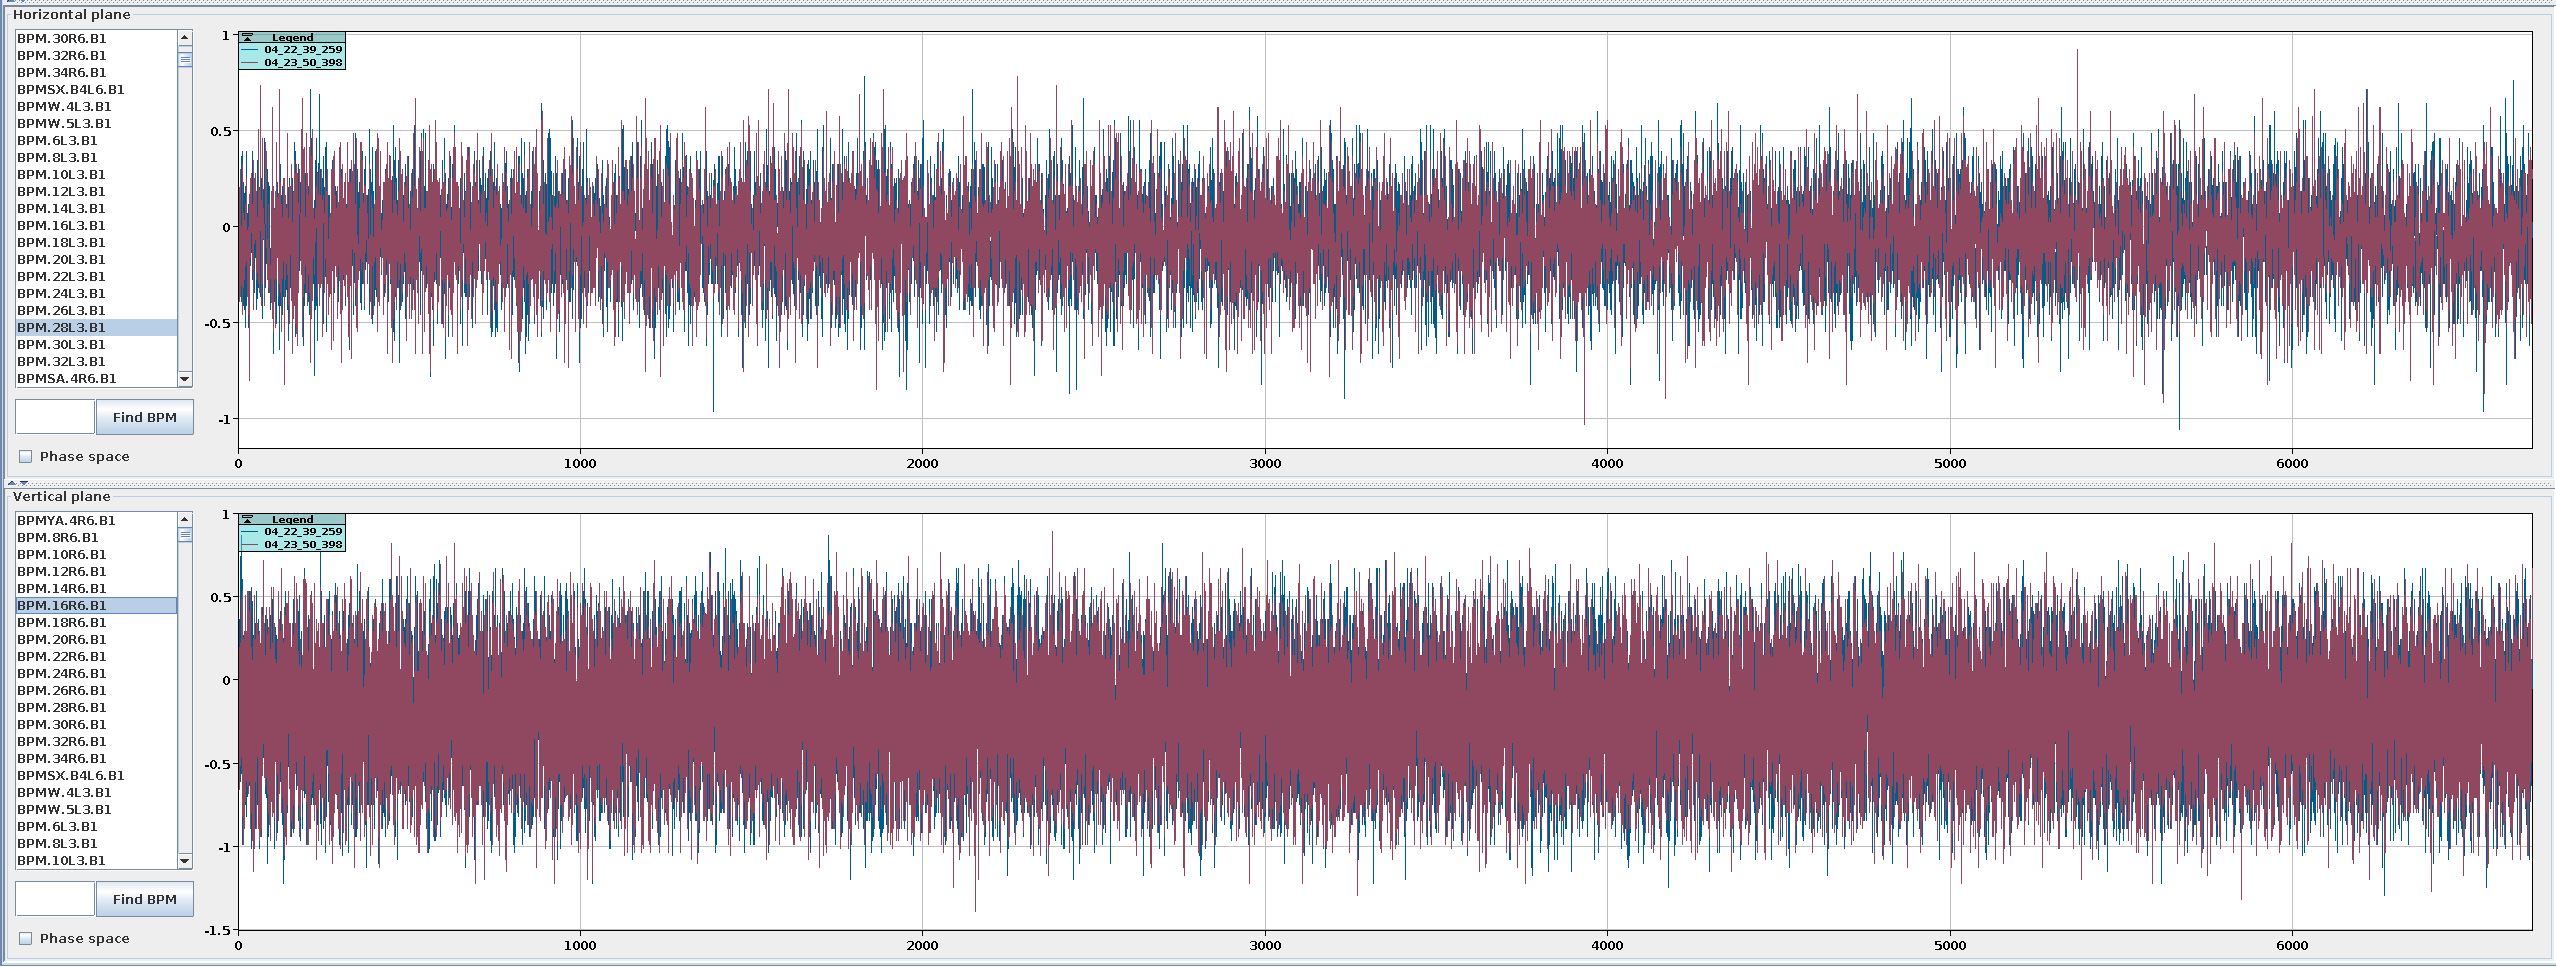
Find BPMs
The BPMs in the list are sorted by longitudinal position in model loaded when the file was opened.
Use the text field and the Find BPM button to quickly find BPMs in the list and automatically select them.
The text input is based on regular expressions and the first BPM matching the pattern will be selected.
Note that ^.* and .*$ will be added automatically to start and end of the string respectively,
to look for your pattern anywhere in the BPM name.
Bad BPMs
After harmonic-analysis has been performed, the bad BPMs will be marked in red in the lists. Hovering the BPM name will show a tooltip with the reason the BPM was deemed bad.
Averages, Removal of Turns and Splitting Files
Broken Functionality
These features are currently broken and we are considering whether they are actually needed.
The buttons on the top left side of the pane provide some features to handle the BPM data.
- Create Average allows loading several data files too visualise their average repesentations on the same graph, which helps detecting differences or reducing noise.
- Remove Turns can be used to cut turns from the start or the end, to focus on a specified range of the data.
- Split Files splits the current BPM data file into N files, where N is specified in the dialogue and the resulting files will have old-turns/N turns.
Start Analysis
The button spawns the configuration dialogue for the analysis. This will call an external program to perform a frequency analysis of the BPM data of the selected files, in order to compute tunes and similar beam properties and (optionally) to get the optics functions from that spectrum. The "Run optics as well" checkbox will define whether the "Optics Analysis" in the "Do analysis Dialogue" is automatically pre-checked.
Do-Analysis Dialogue
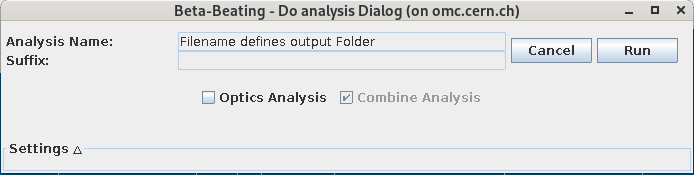
This dialogue allows you to specify the settings and output for the analysis run on the currently selected files in the BPM-Panel. Click the Run button to start the analysis.
Parallelization
Parallelization of the analysis is only implemented on the GUI side, possibly starting multiple python processes. Check the caveats of the "Run Per-File Tasks in Parallel" setting in the GUI-Settings Tab.
Harmonic Analysis
Keeping the Optics Analysis checkbox unchecked will only perform the harmonic analysis.
In this case, you will not be able to specify an output name for the results, as the resulting files will be automatically put into subfolders of the Measurements folder, based on the name of the .sdds files.
They therefore usually appear within the same folder as the turn-by-turn data.
The analysis results are automatically loaded into the Analysis Panel.
Optics
In case the Optics Analysis checkbox is checked, also the optics are calculated.
You have the choice to combine the analysis of all files into a single optics, using the individual measurements for statistics, in which case you need to specify a descriptive output name for the analysis, the prefix of which will already be provided.
If you don't check the Combine Analysis checkbox, the results are stored in a subfolder of the Results folder, based on the name of the .sdds files.
The analysis results are loaded automatically into the Optics Panel.
If you want to take a look at the spectrum, it needs to be loaded manually
into the Analysis Panel from the Results/<Optics Output Name>/lin_files
subfolder.
Loading the lin_files subfolder
If the analysis files are loaded via in the Analysis Panel from the lin_files subfolder,
this folder is copied into the Measurements folder, keeping the lin_files name.
If you want to open another set of analysed files from an lin_files folder, the GUI will complain that the folder already exists.
To avoid this, use the button instead.
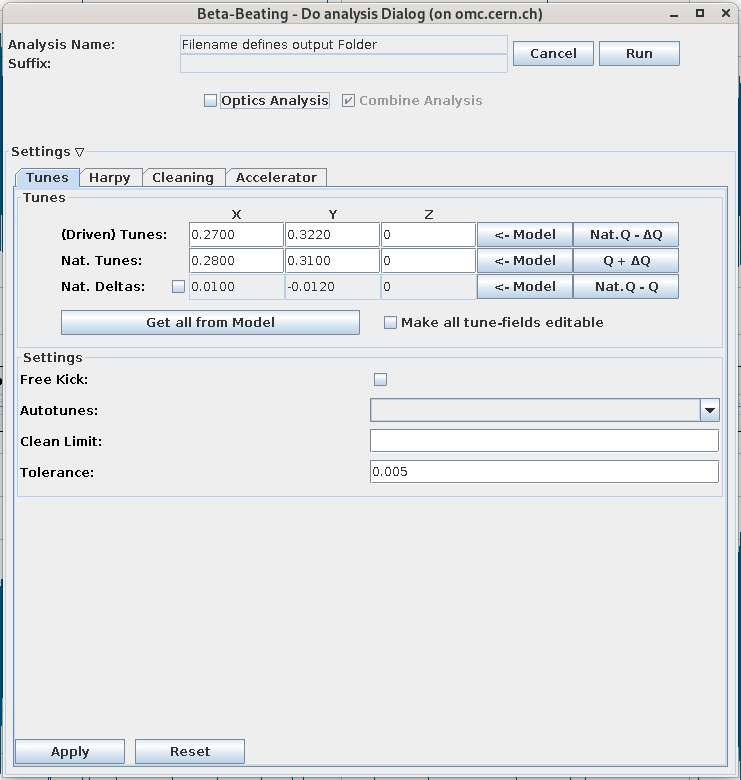
Settings and Suffixes
By expanding the Settings section at the bottom of the dialogue you can optionally change the settings for the harmonic analysis in the Tunes, Harpy, Cleaning and Accelerator tabs, as well as for the optics analysis in the Optics tab if the Optics Analysis checkbox is checked.
The Suffix-field will be automatically set from your suffix-choices in the Harpy settings tab and is only applied to the harmonic analysis output files (i.e. .lin[xy], .amps[xy], .freqs[xy]), not to the folder names.
Changing the Settings
This will change the global settings for all subsequent analysis runs, not just for the current one! You need to click the Apply button to actually apply these settings before the run.