The Segment-by-Segment GUI
The Segment-by-Segment GUI provides a graphical interface to run the segment-by-segment method on various parts of the machine. It allows users to input data, configure settings, run segments, determine corrections and visualise results for various observables. This section will guide you through the GUI's layout and functionality.
The GUI is a Python application built on accwidgets.
It can be run either from the Beta-Beat GUI's Optics Panel after running a full optics analysis, or the command line:
After performing an optics analysis, navigate to the optics panel. With one or more analysis selected, click the Open Segment-by-Segment GUI button in the bottom left to start the GUI.
The SbS GUI is a Python program and part of the omc3_gui package.
It can be started from the command line by providing desired arguments to the following call:
python -m omc3_gui.sbs_gui # args here
Note that this GUI requires the omc3 package, recent Qt bindings (PyQt / PySide) and the accwidgets package which is quite CERN specific.
It is recommended to run it from the Beta-Beat GUI.
After opening, the GUI displays the main window:
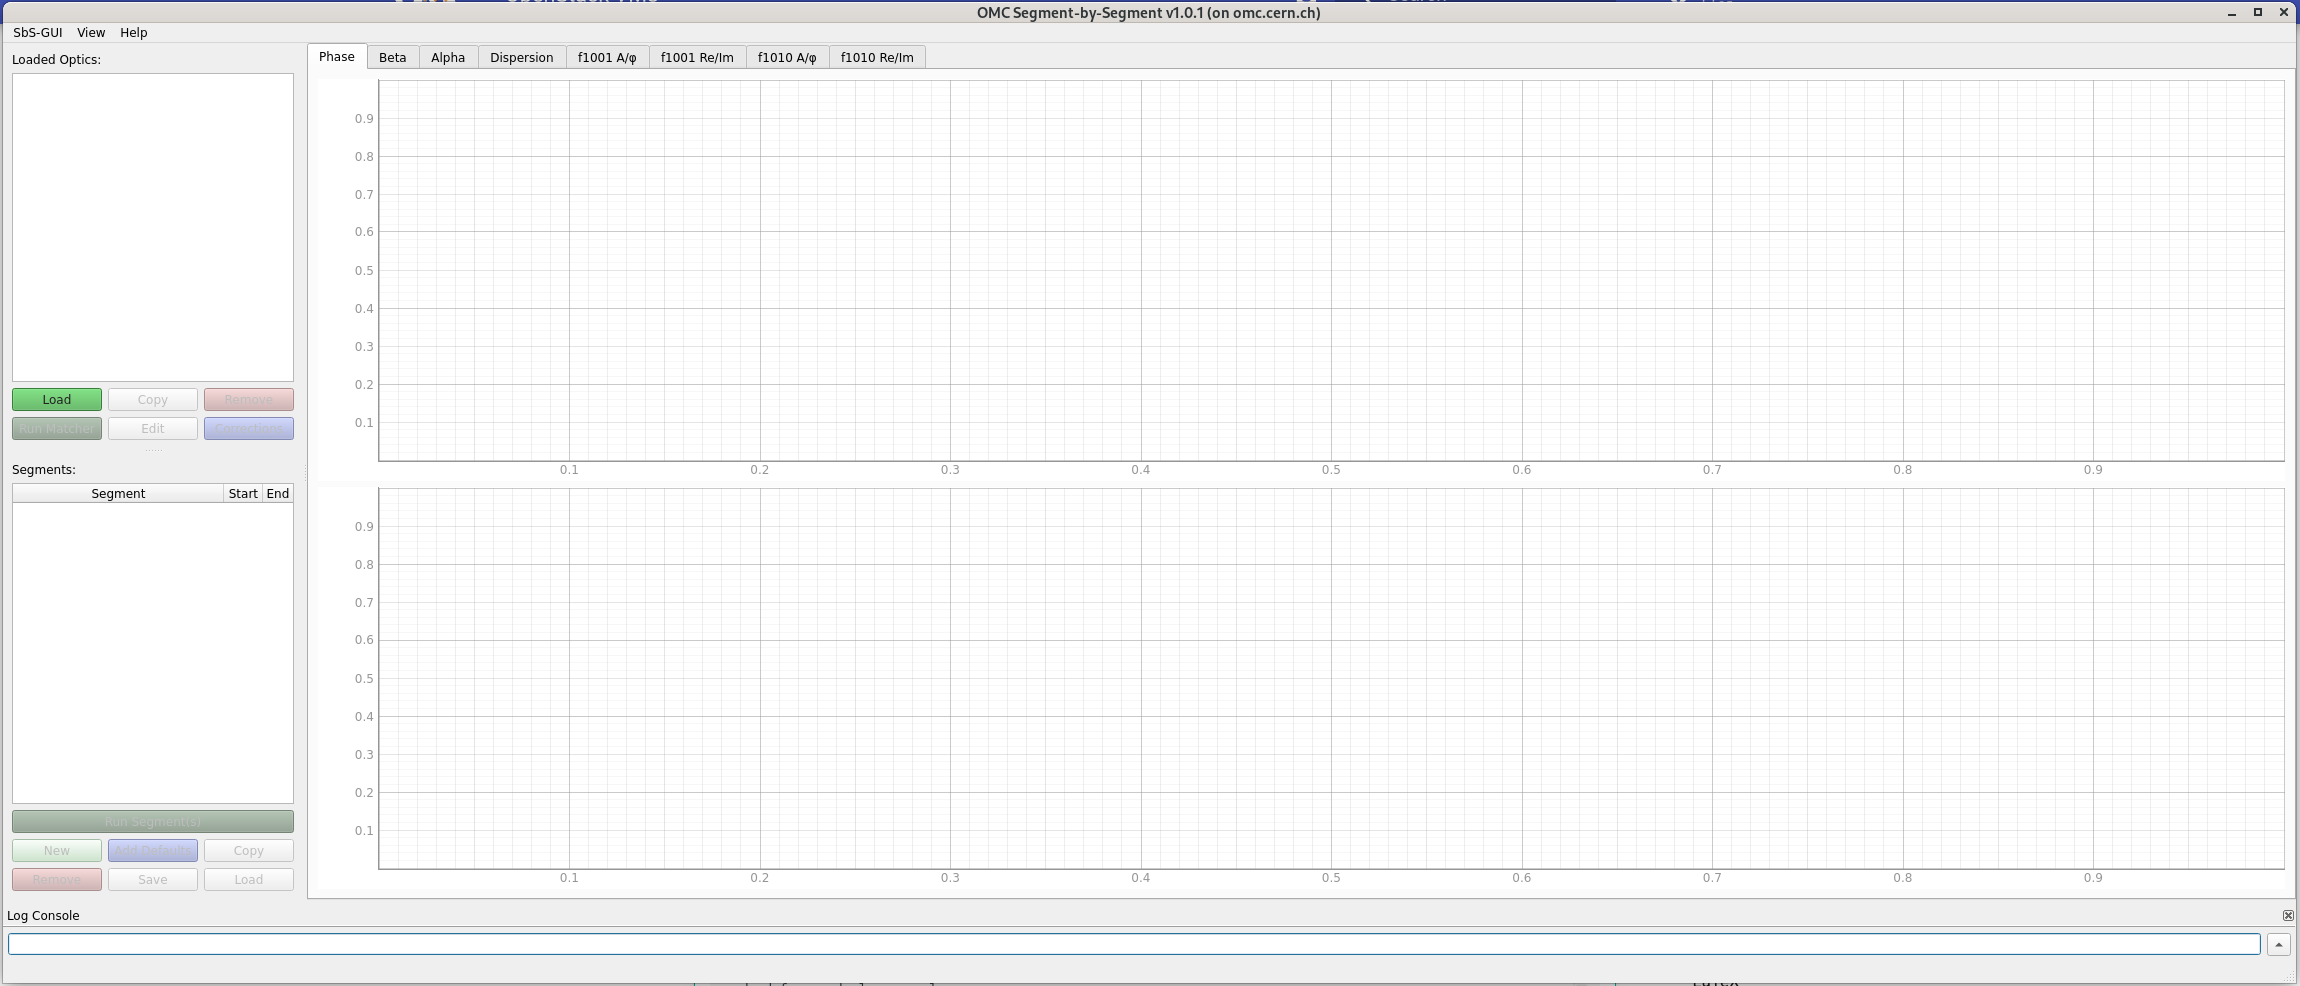
The GUI window is made up of the following main components.
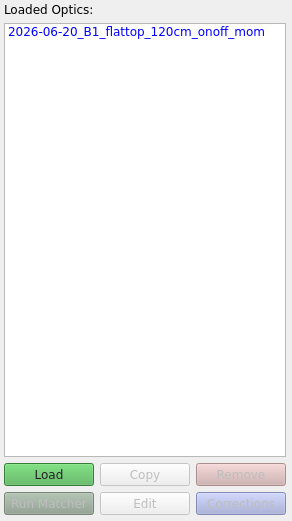
The top left panel displays the loaded measurement data as well as various actions related to data. If started from the Beta-Beat GUI, all optics analyses selected will be loaded.
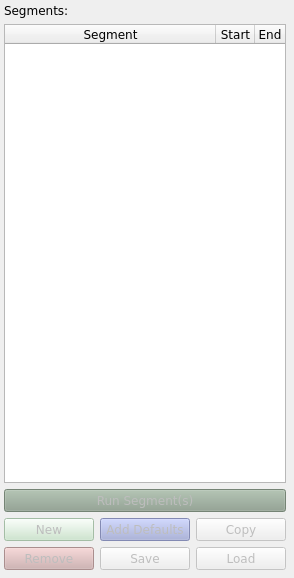
The lower left panel displays the defined segments and buttons to perform actions with those segments.
The main part of the window, to the right of the previous two panels, displays the quantities propagated through the selected segment.
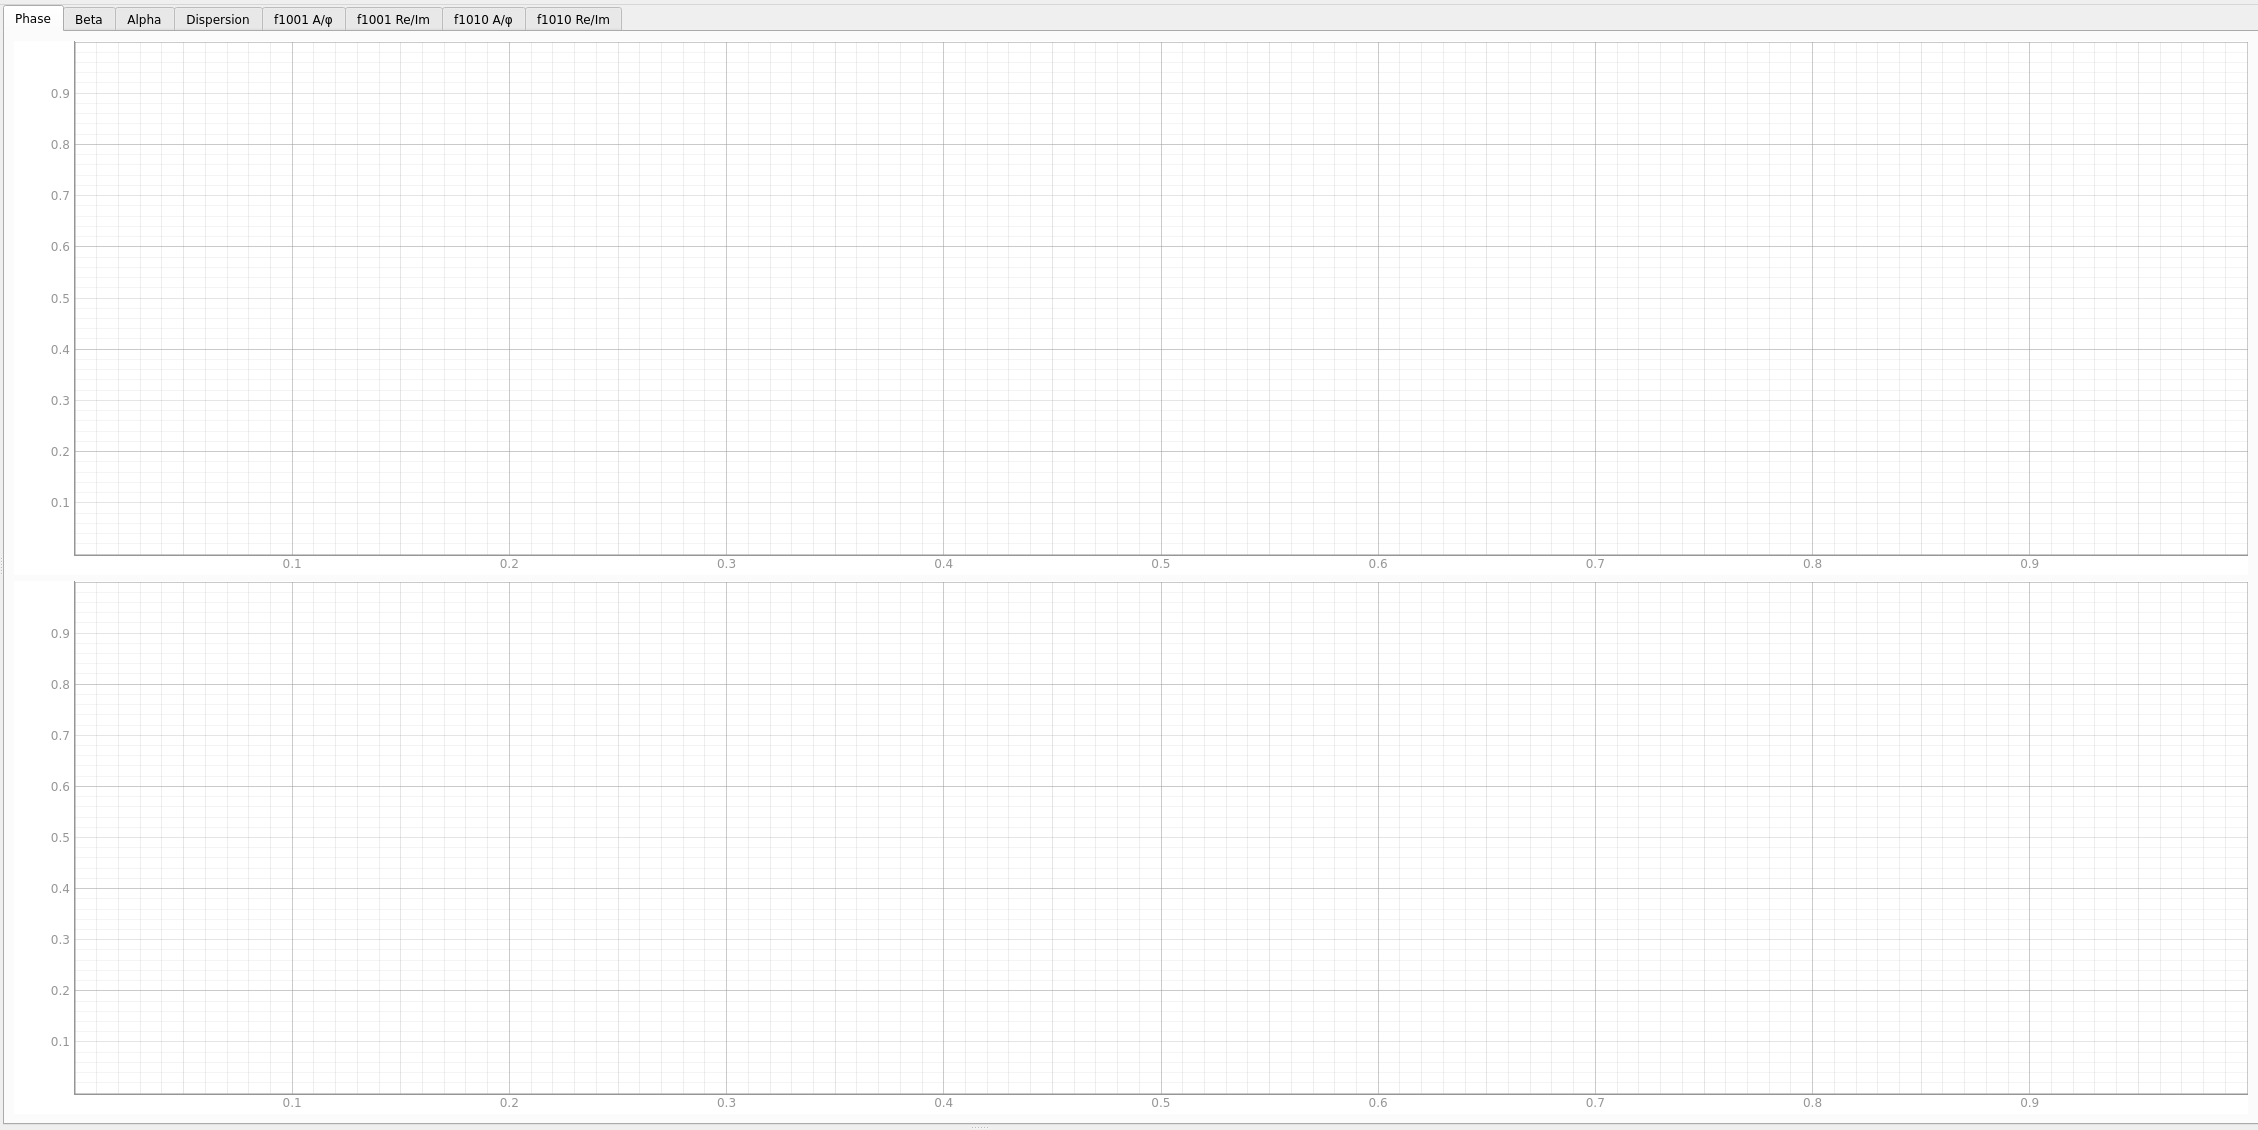
The various tabs in the top part allow the user to select which quantity to plot.
At the very bottom of the window is the log console, which displays logging output from both GUI actions and the underlying Python modules called during the analysis.

It can be expanded or collapsed using the arrow control and closed entirely with the X button on its right side. If closed, it can be re-enabled through the View menu.
Debug Logging
By default, the log console is initialized with log level INFO.
To enable more detailed output for debugging purposes, launch the GUI with the -d flag (e.g. python -m omc3_gui.sbs_gui -d), which sets the log level to DEBUG.
The console panel is also movable and resizable within the GUI window. Right-clicking inside the console opens a context menu that provides access to additional preferences.
The following pages are available:
- Loading Data and Running Segments for how to load measurement data, define and run segments, and interpret the plots.
- Determining Corrections for how to attempt determining corrections and testing their effect through the segments.
- Menus & Settings for the available menus and the meaning of various options.