BPM Filtering
The content of this page has been converted from the presentation given as "OMC3 bad BPM detection" on the 31.03.2025 .
OMC-Analysis
- To get reliable and reproducible optics measurements, we cannot trust all BPM data that we are getting.
- At different stages of the code, we try to determine the "trustworthiness".
- Some BPMs are fully excluded, others are getting errorbars based on their noise-level (which are often used as weights, e.g. for correction calculations).
Automatic
- First the is checked for "obvious" signs.
- : Any value has an (might lead to false positives, but unlikely if happens in multiple datasets).
- : Data contains (happens in SPS BPMs).
- : value was a given threshold (default: 10nm).
- : A in the data, a given threshold (default: 2cm).
- To reduce we perform an SVD-decomposition and keep only the .
- : The BPM had a in the U-Matrix above a given threshold (default: 0.925).
- Most information about the optics come from a .
- : Tune line could in the spectrum.
- : Tune line found was of the other BPMs (default: > \(10^{-5}\)).
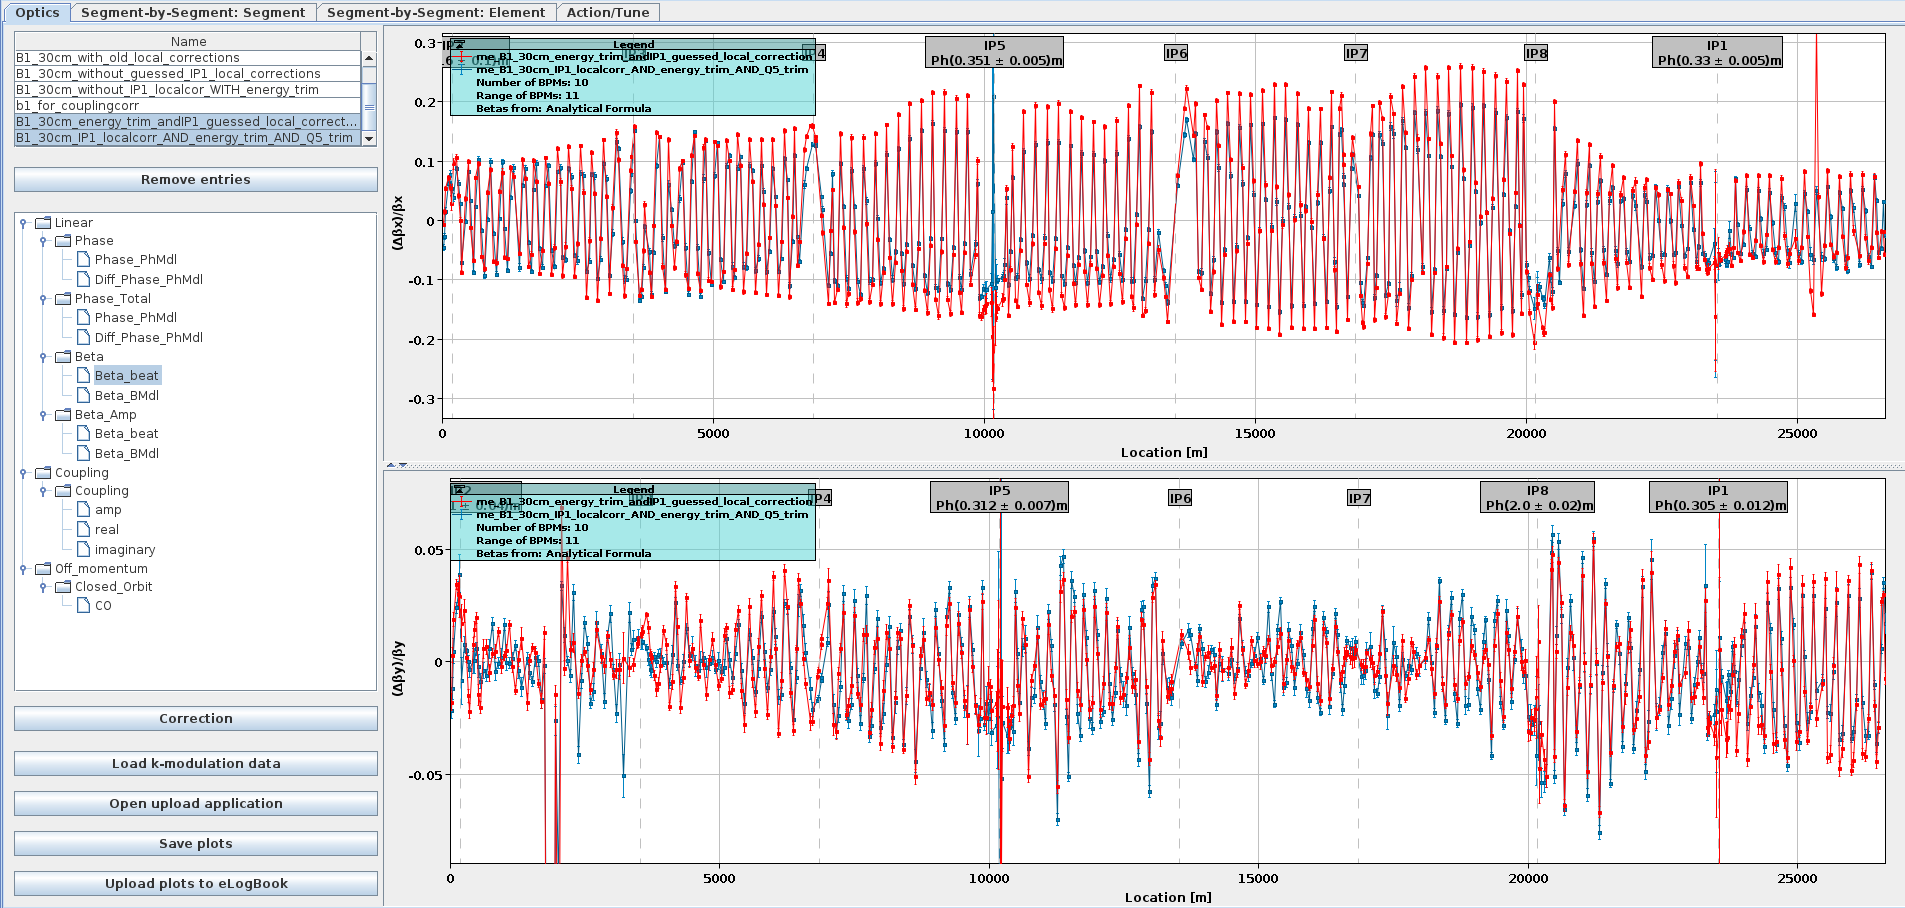
Manual
- : Identified ; sticking out spectrum/optics .
- .
- data points.
- Cause (e.g. phase-offsets, negative \(\beta\), NaNs).
- issues:
- \(\beta\)-from-phase looks normal, peak in \(\beta\)-from-amplitude
- \(\beta\)-ratios large.
- Measure in to .
- Good hint: .
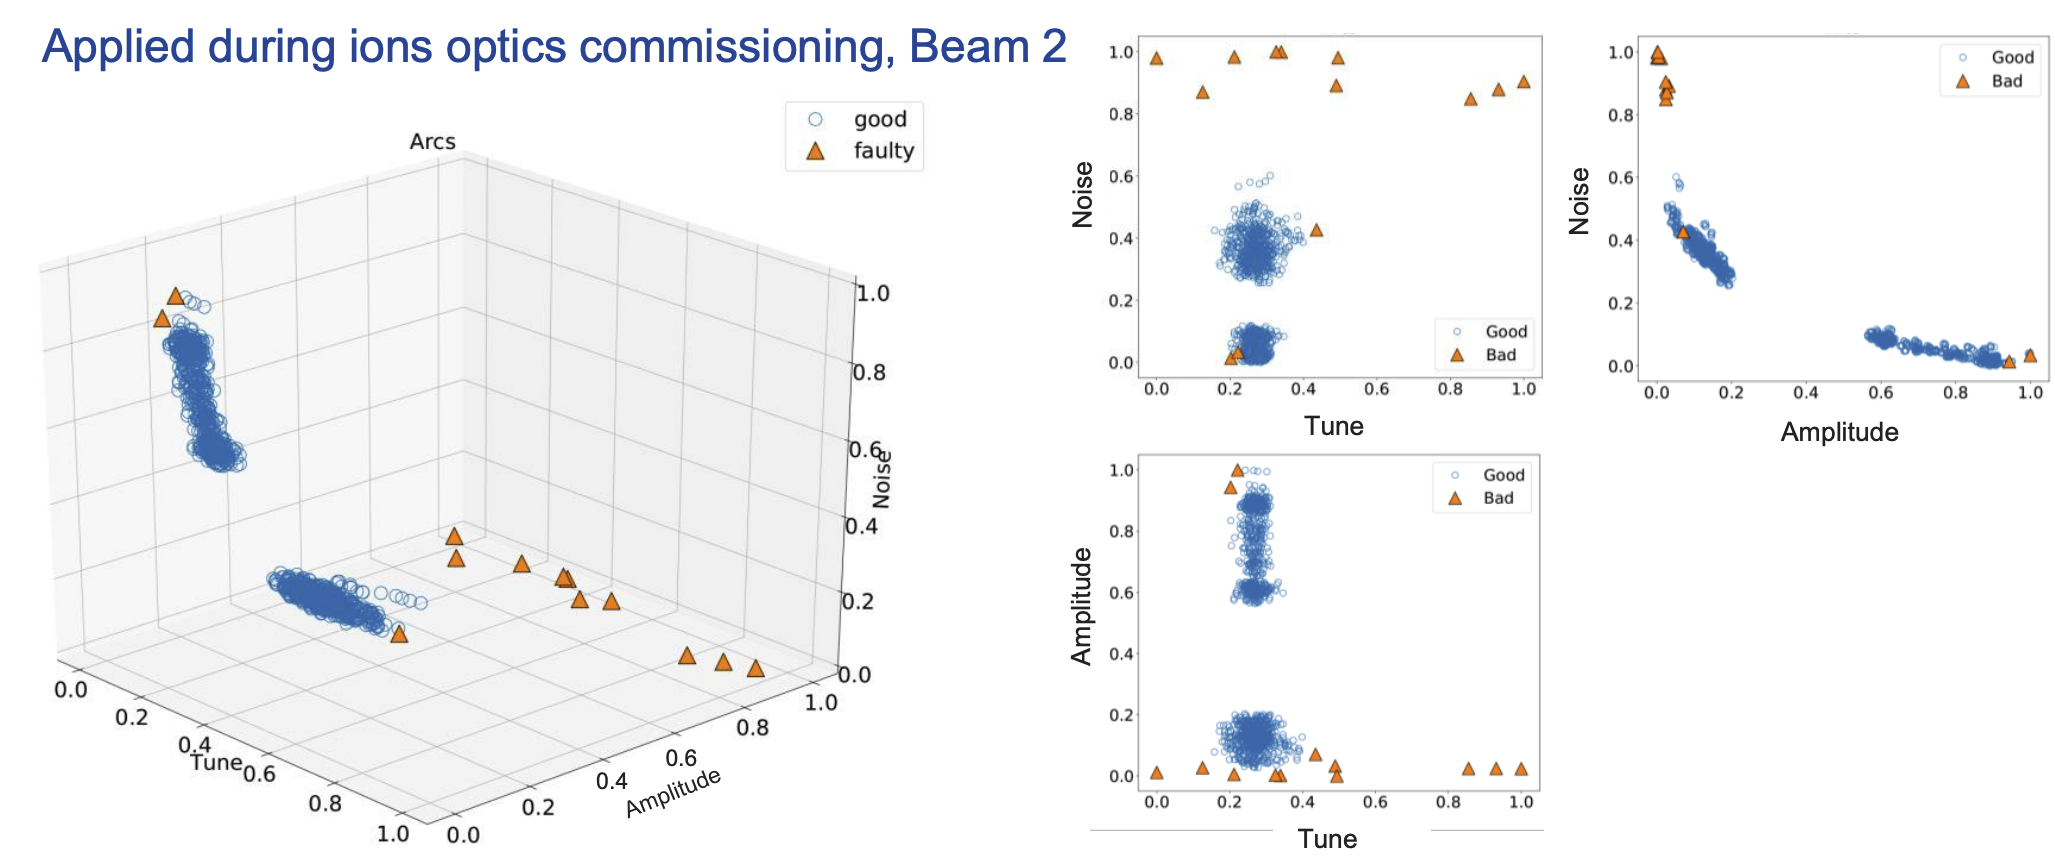
Isolation Forest
Under Re-evaluation
This functionality is currently under re-evaluation and has only been used on a small amount of data in 2021-2024.
- Using to identify Bad-BPMs.
- : Identified BPM, due to being an
E. Fol - Machine Learning for BPM failure detection
E. Fol - Isolation Forest for bad BPMs: performance evaluation
Bad BPMs Summary Script
- Bad-BPMs are written out in files per analysed TbT-Data.
- Script available to gather, summarise and make statistics.
usage: bad_bpms_summary.py [-h] --dates DATES [DATES ...] [--root ROOT] [--outfile OUTFILE]
                           [--print_percentage PRINT_PERCENTAGE] [--accel_glob ACCEL_GLOB]

options:
  --dates DATES [DATES ...]
                        Dates to include in analysis. This should be either subfolders in
                        `root` or glob-patterns for those.
  --root ROOT           Path to the root directory, containing the dates.
                        Default: `/user/slops/data/LHC_DATA/OP_DATA/BetaBeat/`
  --outfile OUTFILE     Path to the file to write out.
  --print_percentage PRINT_PERCENTAGE
                        Print out BPMs that appear in more than this percentage of measurements.
  --accel_glob ACCEL_GLOB
                        Accelerator name (glob for the sub-directories).
Example: All bad BPMs from 2025, written into file and all > 50% in terminal
python -m omc3.scripts.bad_bpms_summary --dates 2025-* \
                                       --accel_glob LHCB* \
                                       --outfile bad_bpms_2025.txt \
                                       --print_percentage 50