Menus and Settings
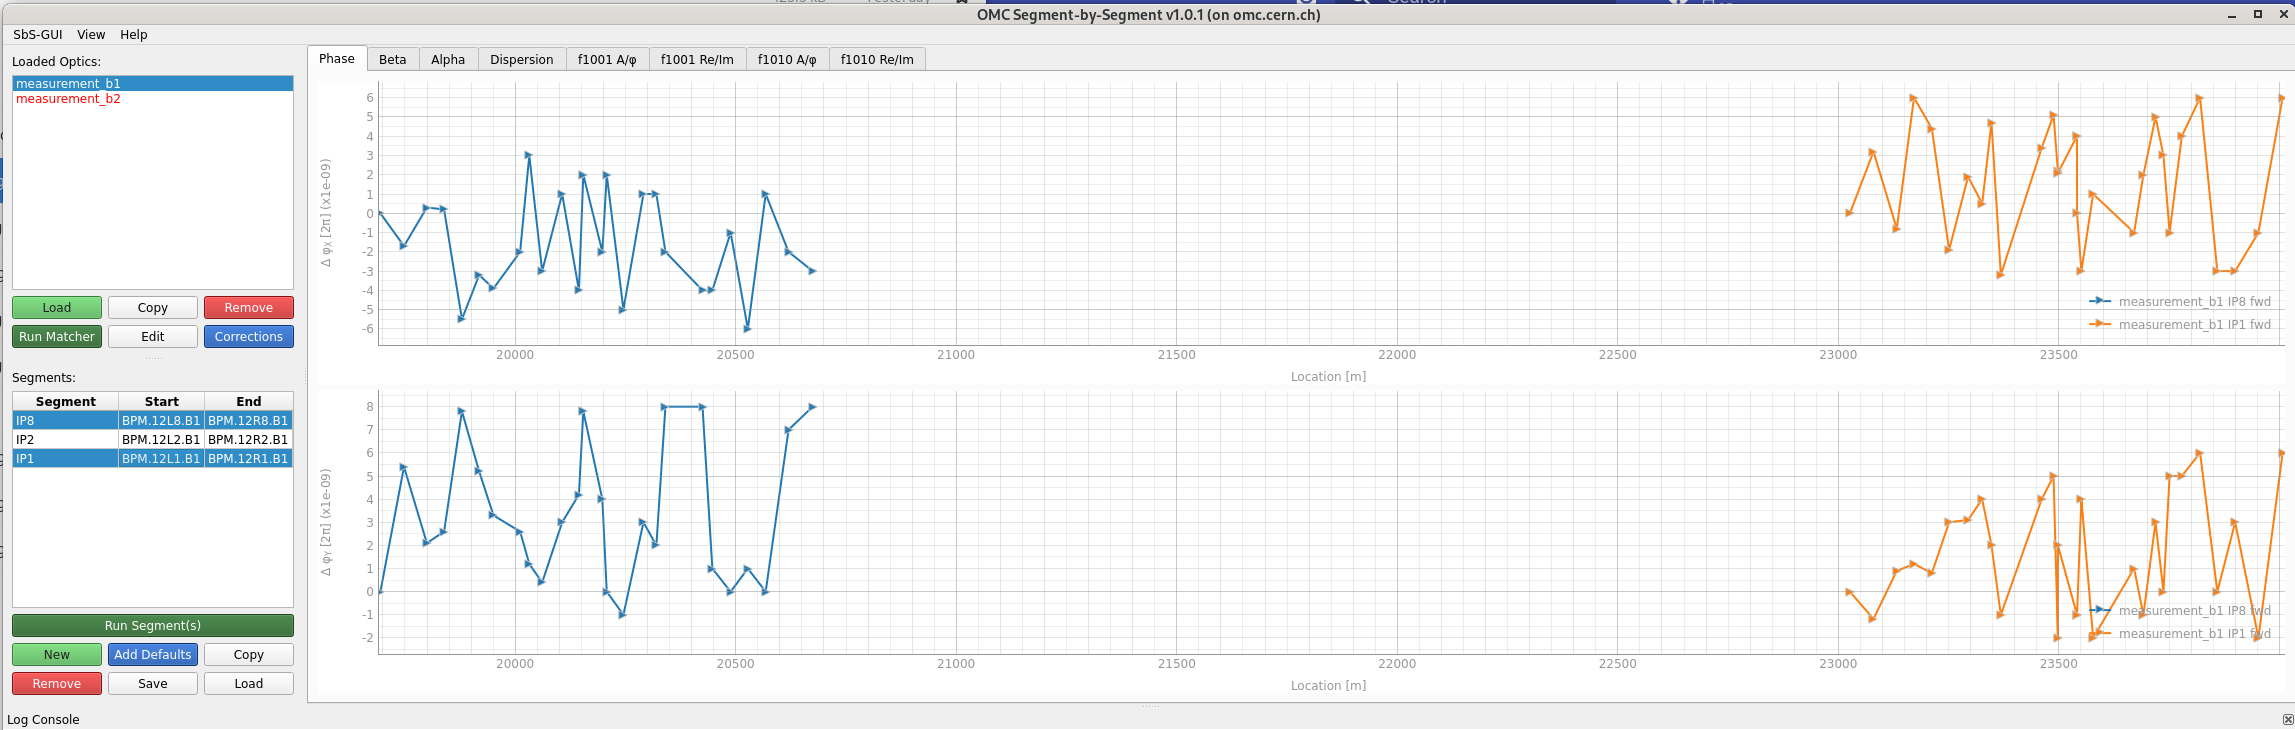
As mentioned in the previous pages, various behaviours and display options can be selected. This page documents the menu bar and configurable settings of the Segment-by-Segment GUI.
Menus
The SbS GUI offers three menus, all located in the top bar of the GUI.
SbS-GUI Menu
The SbS-GUI menu is very succinct.
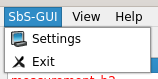
- Settings: Open the settings dialogue.
- Exit: Close the GUI.
Exiting the GUI Cleanly
Please use the Exit option in this menu to close the SbS GUI.
It will signal to the Beta-Beat GUI the process termination and will ensure no dangling processes on the optics servers.
Thank you!
View Menu
The view menu is split into three sections, separated by horizontal lines.
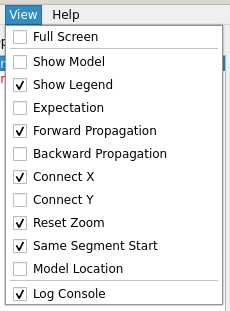
- Full Screen: Toggle full-screen mode.
- Various Plotting Settings: Quick access to the checkboxes of the plot settings.
- Log Console: Show or hide the log console at the bottom of the GUI.
Help Menu
The help menu provides options for reloading data, accessing help, and viewing information about the GUI.
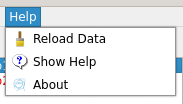
- Reload Data: Reload the data from the input files. This is useful if you have made changes to the input files and want to see the updated results without restarting the GUI.
- Show Help: Open the help dialogue with some main instructions on how to use the GUI.
- About: Opens the about dialogue, which displays some information about the GUI, e.g. the version.
Settings
The settings window is accessible from the SbS-GUI menu, and is split into two tabs.
Note that contextual hints are available on hovering over each setting's text.
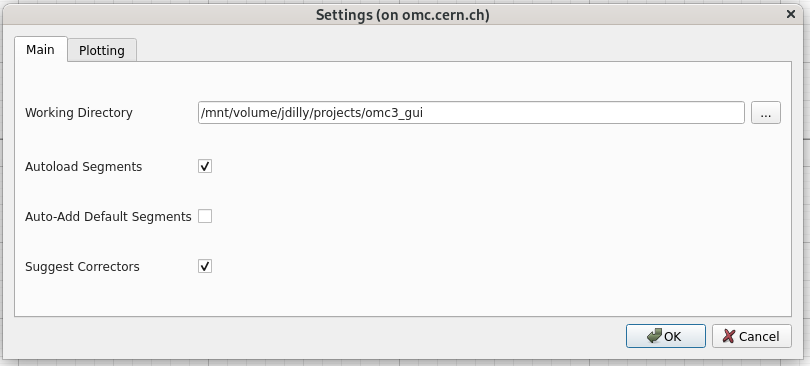
Main Settings
The main settings tab allows configuring the working directory for the GUI as well as various automatic behaviours.
-
Working Directory: The directory where the input files are located. The GUI will use this directory as the default directory when opening file dialogues for loading optics and measurement data.
-
Autoload Segments: Automatically load existing segments when loading a new measurement optics directory. This looks for files created by the GUI in earlier runs and for now only works for a segment if it has actually been run.
-
Auto-Add Default Segments: Automatically add default segments when loading a new measurement optics directory, if applicable.
-
Suggest Correctors: When creating a new correction file in the corrections dialogue, suggest correctors for the default segments that have been added.
Plot Settings
The plotting settings tab controls the visual appearance and behaviour of the segment plots, including marker display, propagation directions, axis linking, and zoom behaviour.
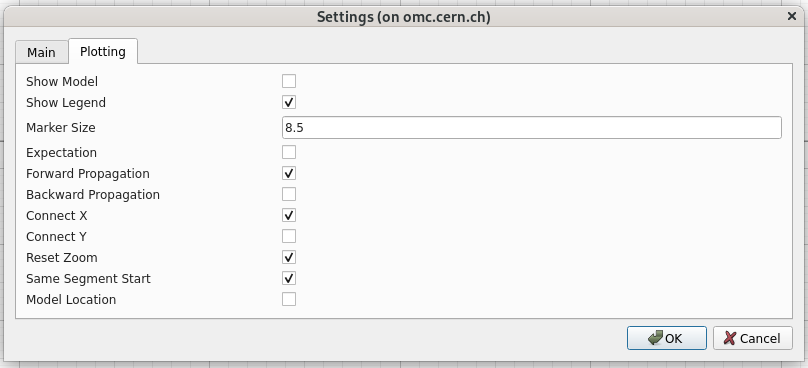
- Show Model: Adds markers for the location of elements in the model to the plots.
- Show Legend: Show legends in the plots.
- Marker Size: Size of the markers in the plots.
- Expectation: If run with corrections, show the expected measurement difference instead of the corrected model difference (see corrected and expected plots).
- Forward Propagation: Show forward propagation results (arrows to the right).
- Backward Propagation: Show backward propagation results (arrows to the left).
- Connect X: Keep the same X-Axis limits for both charts when zooming.
- Connect Y: Keep the same Y-Axis limits for both charts when zooming.
- Reset Zoom: When changing segments, reset the zoom to the original view. When deactivated, the current limits will be kept when changing segments, which can be useful for comparing different segments or optics with the same zoom level.
- Same Segment Start: Plot segments together, even if they have different start BPMs. This is not recommended as it can lead to confusion and misinterpretation of the results: different locations in the accelerator can appear at the same location on the plot.
- Model Location: Plot segments relative to the model location, i.e. their position in the accelerator, which allows for easy comparison of segments with different start BPMs. If deactivated, segments will start at a location of zero at their start BPM.